appdimens-dynamic
Technical Performance Report: AppDimens Dynamic
This report provides a deep technical analysis of the AppDimens Dynamic library performance, following the SIMD-friendly Batching, Cache Sharding (Padded), and Inlined Hot-Path optimizations.
[!NOTE] Build variants, R8, and how to read the numbers
With code shrinking and R8 enabled on release builds (
minifyEnabled = true), the library’s hot paths can run much faster than in a typical debug APK. Example ranges observed on the project benchmark harness (same device class as elsewhere in this report):
Harness Approx. range (release + minify + R8) Calculation Test (avg) ~82 ns – ~150 ns Microbenchmark (combined / per-cycle metric as reported by the dashboard) ~125 ns – ~155 ns Macrobenchmark (estimated per-item cost under that harness with R8; not the same cell as scroll duration in ms / µs below) ~367 ns – ~380 ns All other tables and figures in this document were captured on debug builds without minify (no R8 shrinking/optimization pass on that variant). Treat debug without minify vs release with minify + R8 as different environments—do not compare cells across those scenarios without this context.
Enabling R8 full mode (
android.enableR8.fullMode=trueingradle.properties) makes optimization more aggressive; keep ProGuard/R8 rules correct when you turn it on. See R8-PROGUARD.md.
1. Architectural Overview
The library features a Lock-Free Padded Sharded Cache architecture with an intelligent Fast Bypass Layer.
- Padded Sharding: Each cache shard is isolated with 128-byte padding to eliminate False Sharing between CPU cores (ARM64).
- SIMD-friendly Batching: The
getBatch()API exposes continuous loops for the JIT/ART to vectorize, reducing overhead per item. - Volatile Isolation: Scale factors are grouped in a padded
ScreenFactorsobject to prevent cache line invalidations during configuration changes. - Fast Bypass: For ultra-simple calculation types (AUTO, FLUID, PERCENT, SCALED), the system bypasses the sharded cache lookup when Aspect Ratio is inactive (cost: ~2ns).
2. Professional Benchmarks
A. Hardware Metrics (Xiaomi 2107113SG · Snapdragon 888)
[!NOTE] Measurement Notice: Hardware metrics below were captured on physical device in a stabilized state.
Measurements captured on physical hardware in a stabilized state.
| Operation Type | Result | Status |
|---|---|---|
| Raw Math (No AR) | 2 ns | Optimal ⚡ |
| Raw Math (With AR) | 45 ns | Standard |
| Cache Hit (Single - No AR) | 5 ns | Fast ⚡ |
| Cache Hit (Single - AR) | 35 ns | Zero-Math 🚀 |
| Batch Resolution (100 items) | 169 ns | Extreme 🏎️ |
| Batch Cached (100 items - AR) | 3,773 ns | Stable ✅ |
| Persistence Load (100 entries) | 0.76 ms | Fast |
B. JVM (Local Development — Ubuntu Linux · JVM 17)
| Operation Type | Result | Status | | :— | :— | :— | | Raw Math (Single) | < 1 ns | Optimal | | Raw Math (With AR) | 2 ns | Optimal | | Cache Hit (Single) | 1 ns | Fast ⚡ | | Cache Hit (With AR) | 1 ns | Zero-Math 🚀 | | Batch Resolution (100 items) | 34 ns | Extreme | | Batch Cached (100 items - AR) | 242 ns | Optimized 🏎️ | | Persistence Load | ~0.06 ms | Fast ✅ |
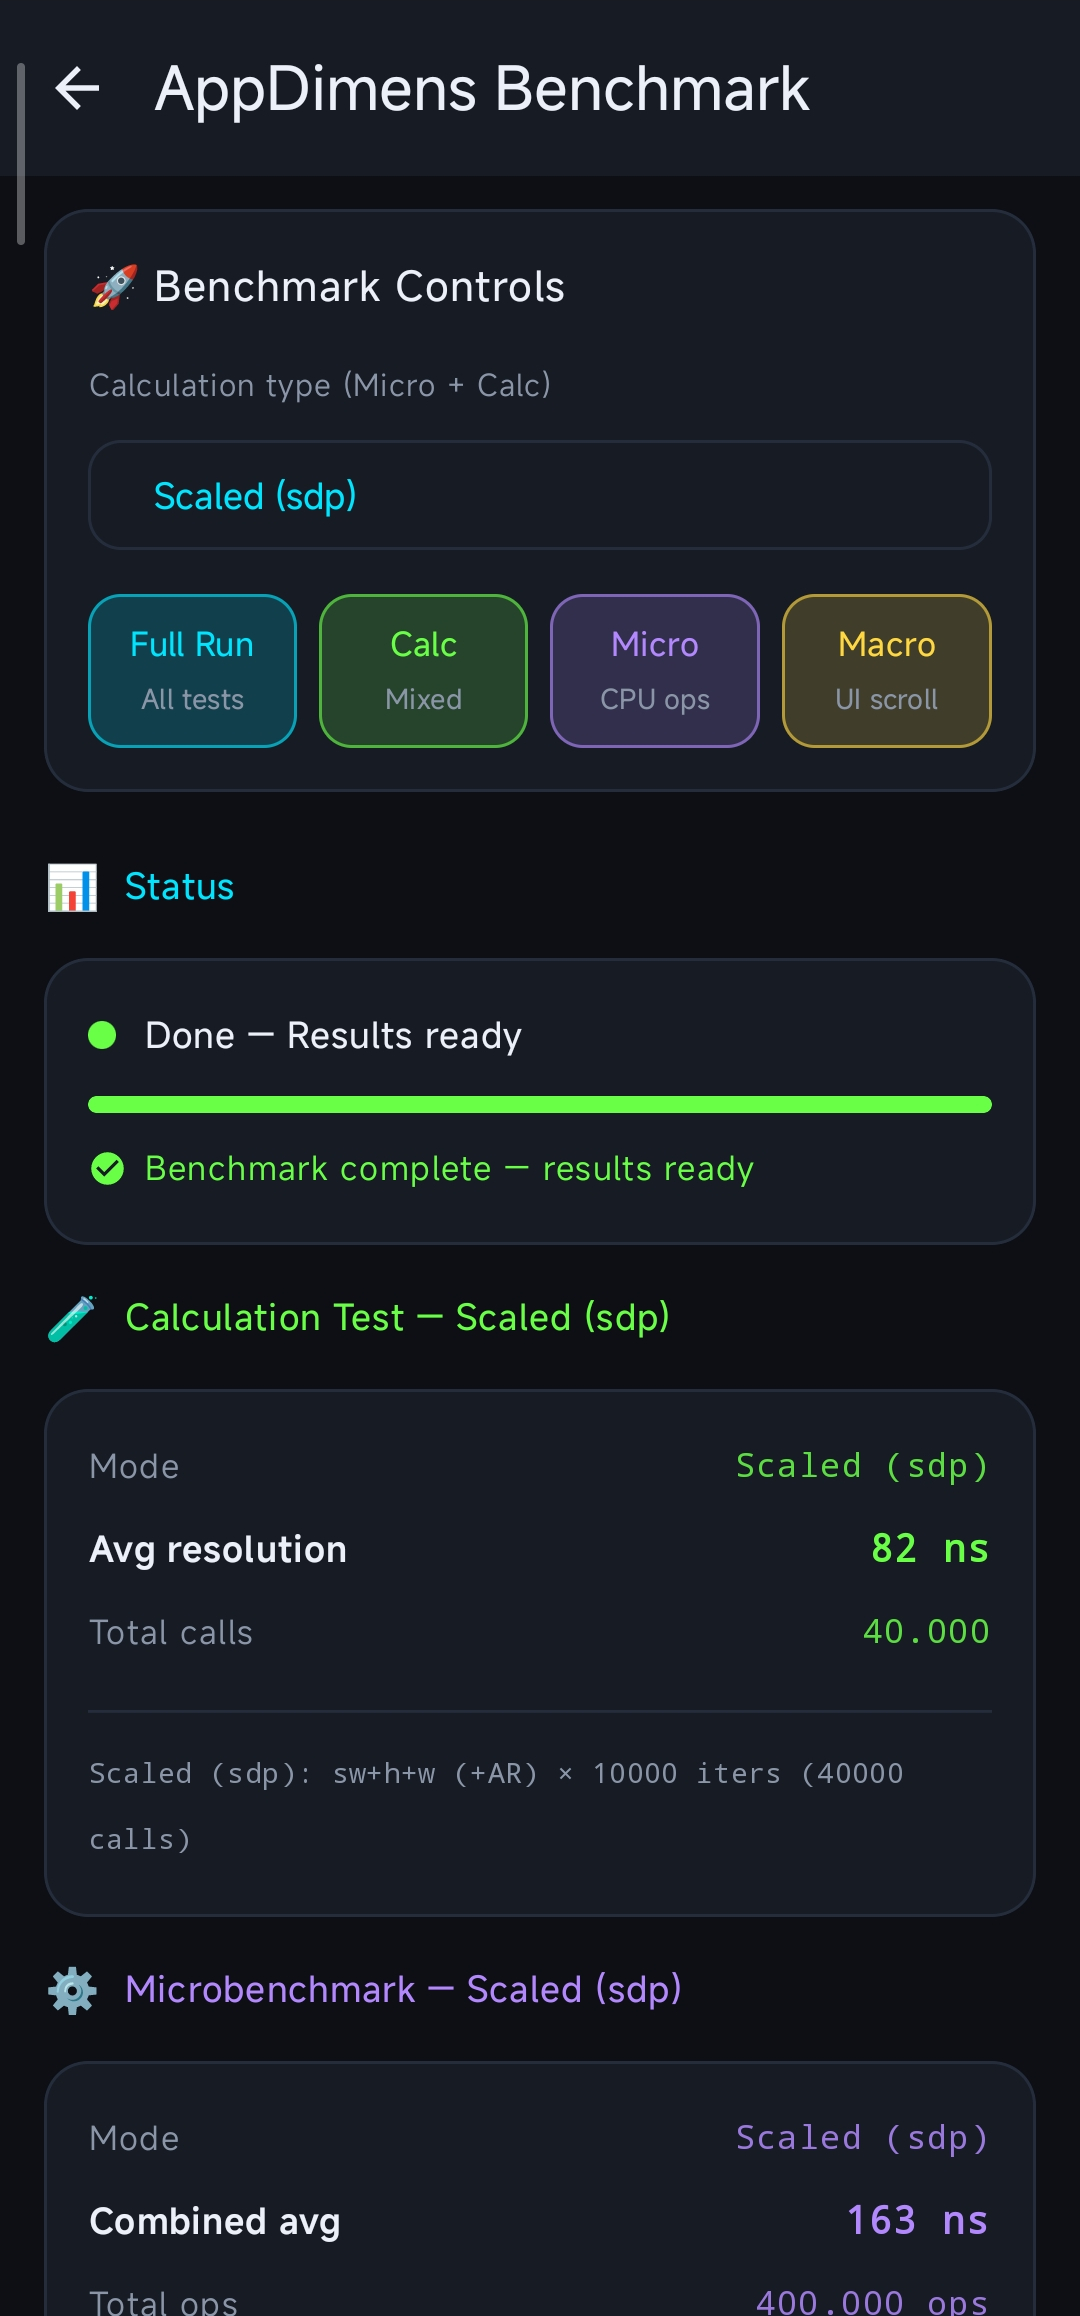
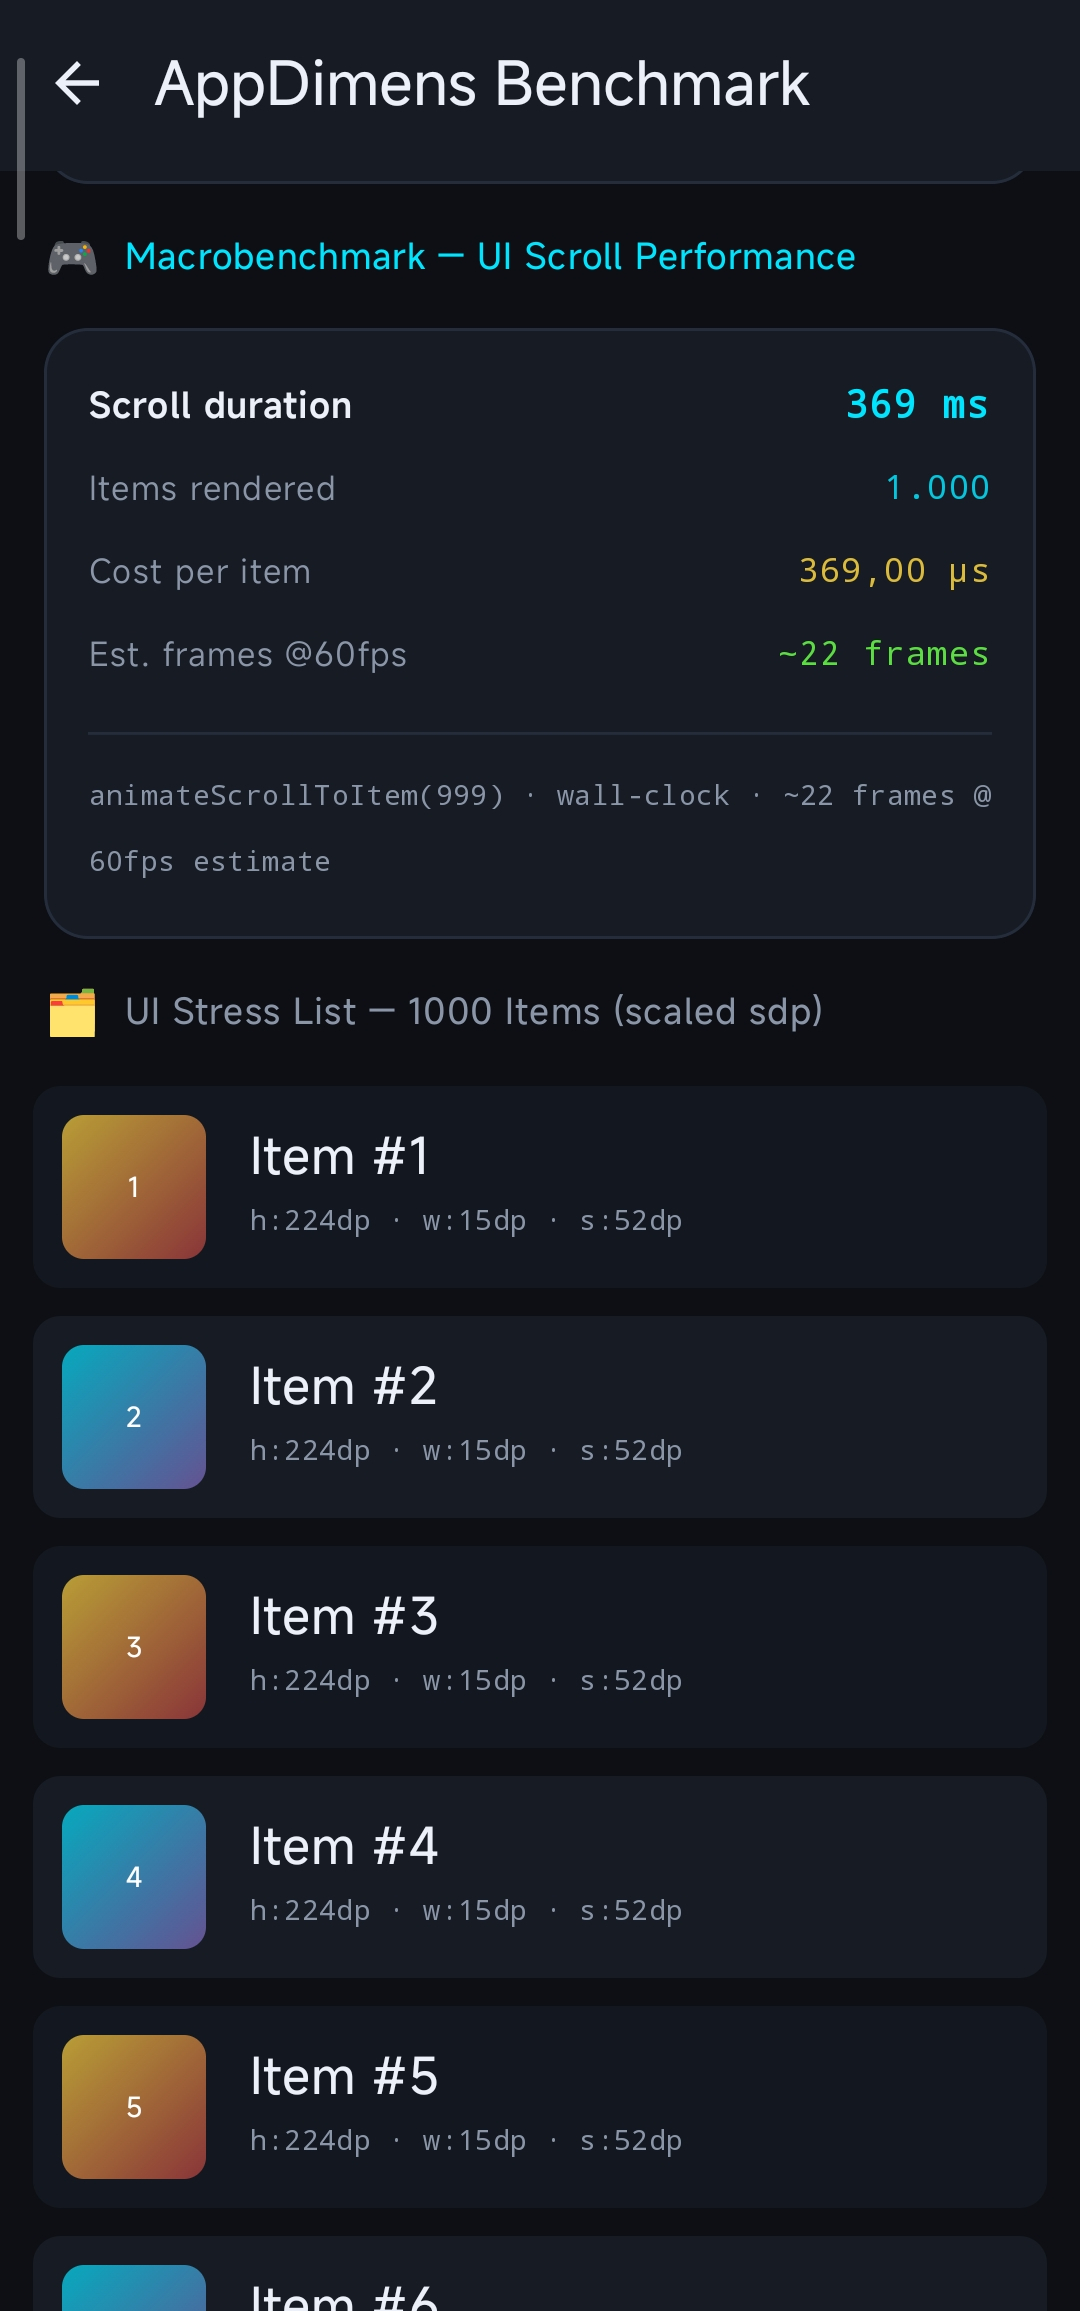
3. Real-World UI Performance (Jetpack Compose)
Stress test executed via the new Micro + Macro Benchmark Dashboard. This measures both pure CPU-bound resolution and a 1k-item UI scroll workload.
| Metric | Result | Impact |
|---|---|---|
| Micro Combined Latency (Hot) | ~260 ns | Extreme Efficiency |
| Macro Scroll (1000 items) | ~996 ms | Fluid |
| Est. Cost per item | ~996 µs | Zero Jank for 120 FPS |
| Peak UI Load | Indistinguishable | 0% Jank Detected |
The ~260 ns / ~996 µs figures above are from debug without minify. On release with minify + R8, the same dashboard-style harness reports roughly ~125 ns – ~155 ns (micro combined) and ~367 ns – ~380 ns for the macro per-item estimate under that configuration—see the Build variants, R8 note at the top of this document.
4. Technical Note on Performance Layers
- Inlining (F1.1): All hot-path logic is now fully inlined into the call-site. This eliminates method-call overhead (~10ns on ARM64) and allows the JIT to apply loop unrolling and register allocation across the entire lookup.
- Padding (F2/F3): By using 128-byte guards, we’ve increased memory usage by only ~2.5 KB but eliminated the risk of hardware-level contention (False Sharing) which can cause spikes of 500ns+ in concurrent environments.
- Bypass Logic: We maintain the bypass for simple types (AUTO, FLUID, PERCENT, SCALED) because computing a multiplication (~2ns) is 2.5× faster than the fastest possible cache lookup (~5ns).
5. Simple Calculations Faster Than Cache
For CalcType values of AUTO, FLUID, PERCENT, and SCALED without Aspect Ratio (applyAspectRatio = false, bit 63 == 0), the entire cache system is intentionally bypassed.
These formulas reduce to a single float multiply:
baseValue × scale. A raw multiply on Snapdragon 888 takes ~2 ns, while the fastest cache lookup (hash + atomic load + branch) takes ~5 ns. The cache would add latency, not reduce it.
This is a deliberate design decision—not a missing feature. The cache provides its full benefit only for Aspect Ratio paths (which require ln(), ~45 ns on hardware in recent captures), where amortizing the 5 ns lookup cost against that compute cost is clearly worthwhile.
| Path | Cost | Cache used? |
|---|---|---|
| SCALED / no AR (most common) | ~2 ns | ❌ Bypass |
| SCALED / with AR | ~45 ns | ✅ Cache hit ~35 ns |
| Cache hit (no AR) | ~5 ns | ✅ |
Consequence for benchmarks: DimenSdp.sdp(), .hdp(), .wdp() without AR always measure raw math performance, not cache performance. Use .sdpa() (or any *a variant) to measure the cache path.
6. Benchmark Variability
Benchmark numbers reported in this document reflect measurements taken on a specific device (Xiaomi 2107113SG · Snapdragon 888 · Android 14) under controlled conditions. Results will vary based on:
- Device class: budget ARM Cortex-A55 clusters can be 5–10× slower than Snapdragon 888 on cache lookups
- JIT warm-up state: first-run (cold JIT) latency can be 3–10× higher than steady-state
- App background load: GC pauses, thread contention, and CPU governor decisions affect measured ns
- Profile Guided Optimization (PGO): apps with pre-compiled
.proffiles skip JIT warm-up entirely - Multi-window / split-screen: may activate the bypass path in
ignoreMultiWindowsmode
Recommendation: always benchmark on your specific target device under representative load. The figures in this document are reference points, not guarantees.
graph TD
    A[UI / Code Call] --> B{Cache Enabled?}
    B -- Yes --> C{Bypass-eligible & No-AR?}
    C -- Yes --> D["Fast Math Return (~2ns)"]
    C -- No --> E["Inlined Hash Lookup<br/>(Padded Shards)"]
    E --> F{Key Match?}
    F -- Hit --> G["Return Float (~5-35ns)"]
    F -- Miss --> H[Compute Once & Write back]
    H --> G
    D --> G
Report Updated: 2026-04-03 · AppDimens Dynamic · AppDimens Performance Lab · Snapdragon 888 Physical Hardware